


Power BI Update October 2018
It’s that time again: Microsoft has again provided new extensions for the product “Power BI”, which simplify the work of the developer and offer new display options.
Among the most exciting extensions are the “
Fuzzy Matching
“, a way to join tables over imprecise fields, and the “
Data Profiling
“, which is used for debugging. Furthermore, the “
Composite Models
” and the “
Aggregation
” function are now supported and can not only be used as previews, but can also be included in reports.
But now to the individual topics:
Reporting
For the “
Reporting
“, this time there are mainly enhancements for the facilitated user input. This way, it is now possible to search for filters, which is a great relief especially when there are many filters. Keyboard input and navigation when creating a report has been enhanced again and screen readers are now supported as well.
In addition, the context menu has been extended so that fields can be moved within the areas and also to other areas via it.
The performance for the ArcGIS map has been increased immensely. Now changes are displayed immediately and significantly more points (up to 30,000) can be displayed on the map.
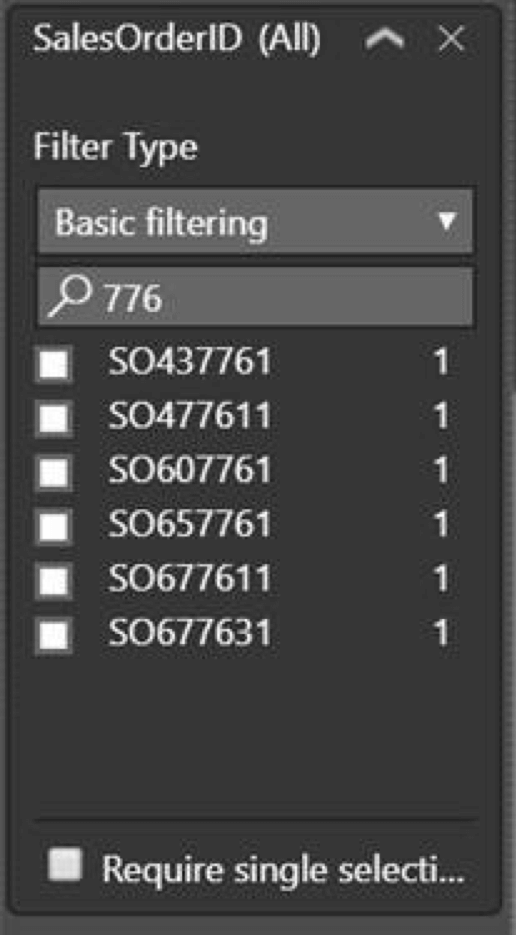
Figure 1 – Search on filters
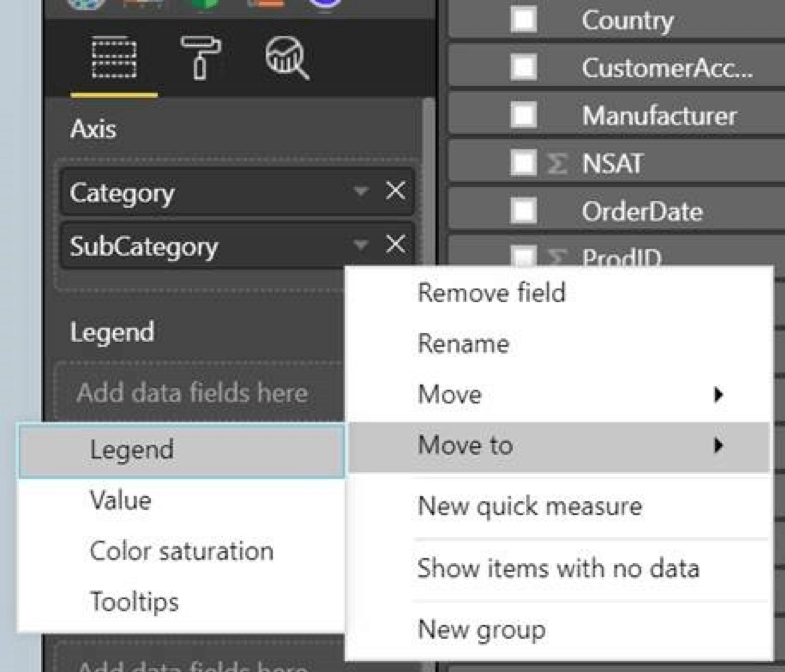
Figure 2 – Advanced context menu
Modeling
With the “
Modeling
“there is only one extension this month. For the “
DAX Editor
“, improvements have been introduced that should be familiar to developers from other development environments. Many shortcuts have been introduced, such as moving a line with “
Alt + arrow keys
” or jumping to an associated parenthesis by”
Ctrl + Shift + \
“.
Shortcut |
Action |
|---|---|
| Alt + ↑ / ↓ | Move line up/down |
| Shift + Alt + ↓ / ↑ | Copy line up/down |
| Ctrl + Enter | Insert line below |
| Ctrl + Shift + Enter | Insert line above |
| Ctrl + Shift + \ | Jump to matching bracket |
| Ctrl + ] / [ | Indent / outdent line |
| Alt + Click | Insert cursor |
| Ctrl + I | Select current line |
| Ctrl + Shift + L | Select all occurrences of current selection |
| Ctrl + F2 | Select all occurrences of current word |
Analytics
The item “
Analytics
” contains 2 items this month.
The first is the possibility of publishing “
Composite Models
” and the “
Aggregations
“, which until now were only available as previews.
The second item is an update to the analysis of increases/decreases in non-additive measurements. Depending on the type of display used, the increases/decreases will be displayed differently and will clearly show the individual data affecting the change. These diagrams can then be added to the report simply by clicking the plus button.
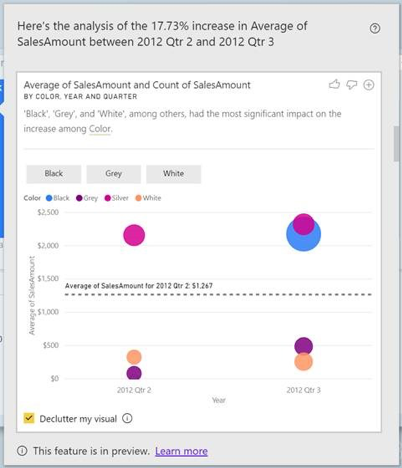
Figure 3 – Analysis of changes in a diagram
Custom Visuals
At the “
Custom Visuals
” there is an update of “
Mapbox
“, a 3D representation of maps, with which e.g. Data of certain parts of an area can be displayed three-dimensionally. Here you can now also zoom into the individual areas and the possibility of a search has been added.
The diagrams of “Akvelon” have the possibility to select several columns by square. Filters can then be selected with this selection.
“3AG Systems” provides charts that can compare 2 scenarios, charts indicating absolute and relative variance.
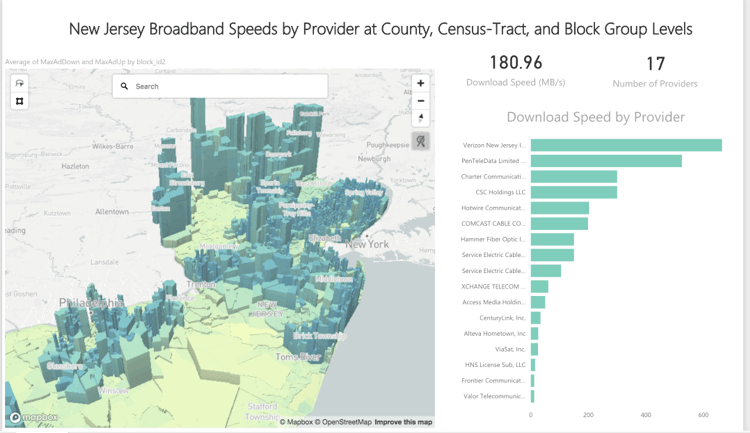
Figure 4 – Mapbox
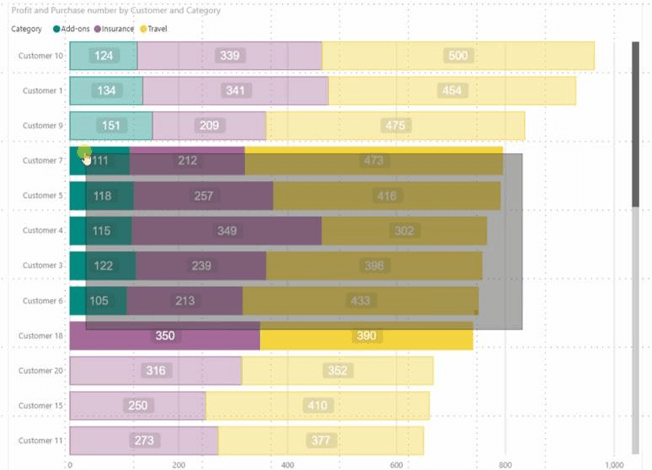
Figure 5 – Akvelon
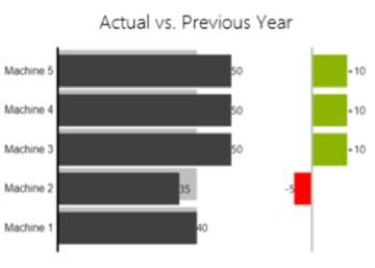
Figure 6 – 3AG Systems – absolute variance
Data Connectivity
For the “
Data Connectivity
“, the “
Web By Example connector
“, the “
SAP BW Connector vs2
“, the “
SAP BW Message Server connector
“, the “
Vertica connector
” and the “
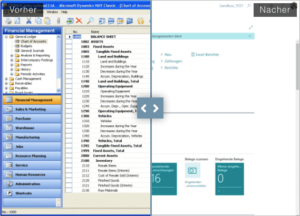
Dynamics NAV and Dynamics 365 Business Central
” have now been made generally available. Additionally the “
Dynamics 365 Business Central On-premises connector
” has been added.
To use these connectors, existing “on-premises data gateways” must be upgraded to the October version.
Data Preperation
Here are 2 useful extensions that make it easier for developers.
In the “
Power Query Editor
“(Preview) there is now an easy way to identify errors and empty values. This can be activated via the “
Preview features tab
” under File -> settings. This extends the display with a small line that shows the number of errors and directly gives the possibility to edit the errors.
More functions are to follow soon in this area.
As a further preview the “
Fuzzy Matching
” has been introduced. Merging tables has always been possible, but now it is also possible to do this via “fuzzy matching”, which links similar content. You can specify how exactly the matching should be done and which contents, such as the name of the user, should be displayed. spaces and upper and lower case, should be respected.
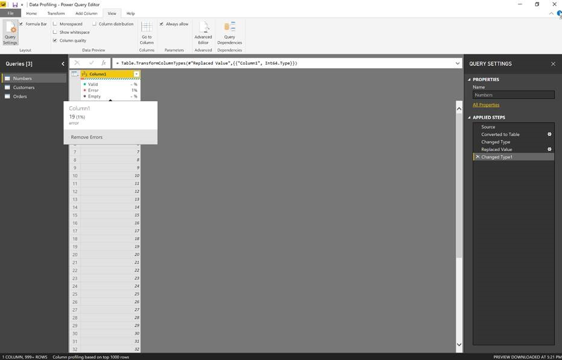
Figure 7 – Data Profiling
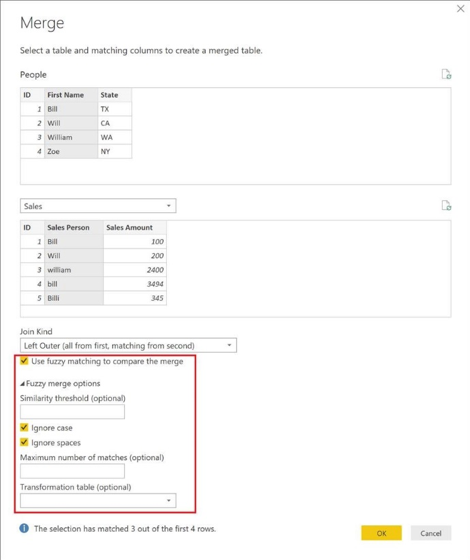
Figure 8 – Fuzzy Matching
Others
Added control of data export for developers so that you can give individual reports different properties as to how the end user is allowed to export the data.
For the individual security needs of the users the “
Transport-layer security
” properties have been added, where admins can make security settings.
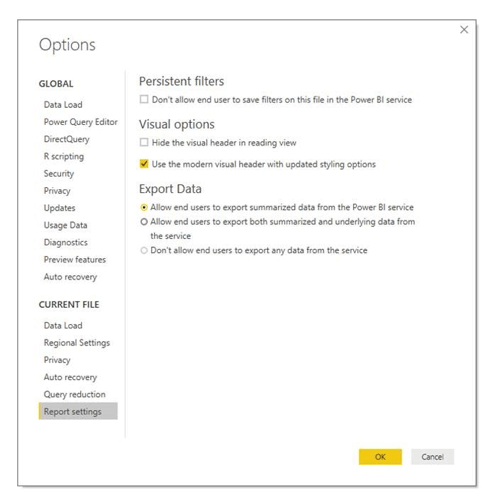
Figure 9 – Exporting the data
For the next updates, the focus will be on the color saturation of the displays, which were often criticized.
So there is a lot to experiment with again this month. Have fun with it.
Until next time.
Tobias Wirths
If you would like to learn more about the possible uses of Microsoft Power BI or need a partner for the implementation, please contact us!