


Power BI – November Summary
A few days ago Microsoft presented the new developments for their product “Power BI“. This time there are many improvements for the developer, but of course also exciting enhancements for the visual display.
Reporting
There are 2 major and very useful enhancements here.
On the one hand, it is now possible to expand individual row headers. Previously, there was only the option to expand everything, so the table quickly became confusing, even though you only needed a certain amount of information.
By right-clicking on the column header you will now find the entry “Expand”. As a sub-item there is the option “Selection”, which opens only this one header. But in this menu you can also expand the entire layers under this header or directly everything.
Alternatively, you can add small plus signs to the heads via the visualization tab that expand the individual heads, just like you know from pivot tables.
On the other hand, there is now the possibility to copy visuals from one report to the other. If the same fields are present in the new report, this works fine. If this is not the case, you can replace the individual fields that are not present in the new report.
When it comes to filtering, Microsoft has listened to user feedback and made the filter functions more generic and clearer. The filtering introduced as a preview includes the following functions, among others.
It is now possible to hide individual filterings for the user and to make filterings not editable, but only displayable. In general, you can define which filters should be displayed or hidden for the user.
To activate these new functions, you just have to set a checkmark in the options.
If this is done, a new filter tab will appear, showing the filters used and replacing the old tab in the future.
Visually, of course, you can customize the new tab so that it integrates seamlessly with the report in question.
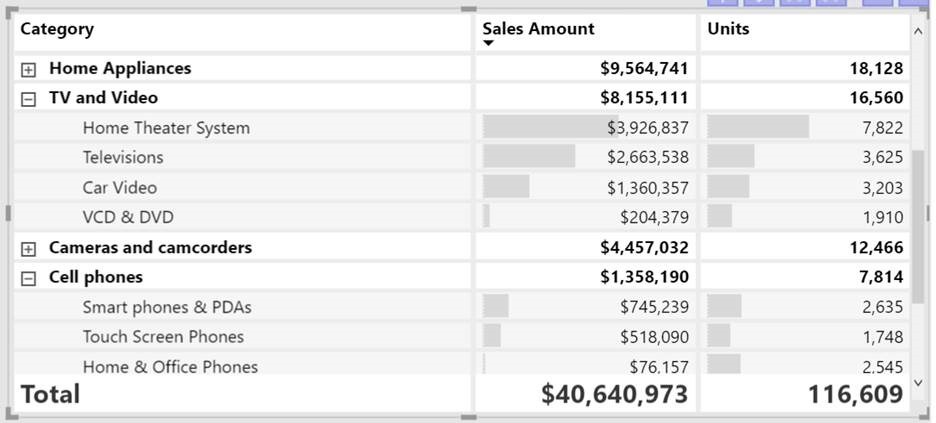
Figure 1 – Unfolding individual heads
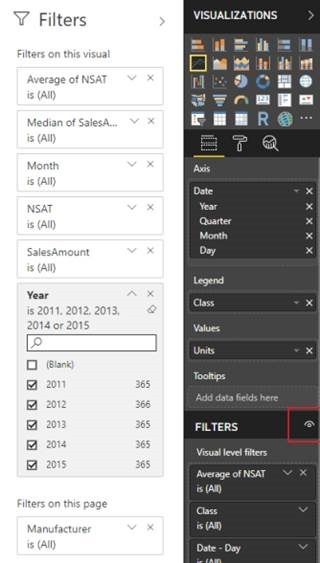
Figure 2- New filtering tab
What Microsoft has been improving for several updates is the ease of input for the developer of the reports. Also this time there is news on this topic.
The selection area, the start dialog, the warning messages and much more are now controllable by keyboard and screen readers are supported, which was already introduced in other areas in previous updates.
Analytics
There are also renewals in the Analytics area. Until now there were 2 different ways to dynamically adjust the colors of visuals to the values. This has now been unified so that all elements get the dependent formatting feature that was used for tables before.
The function can be found under the item Data colors.
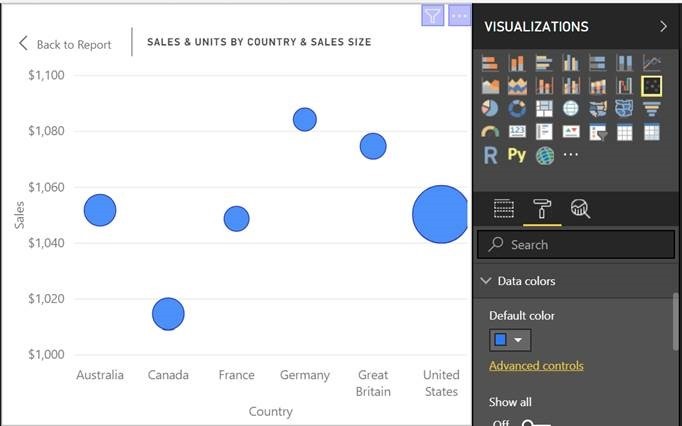
Figure 3 – dependent formatting
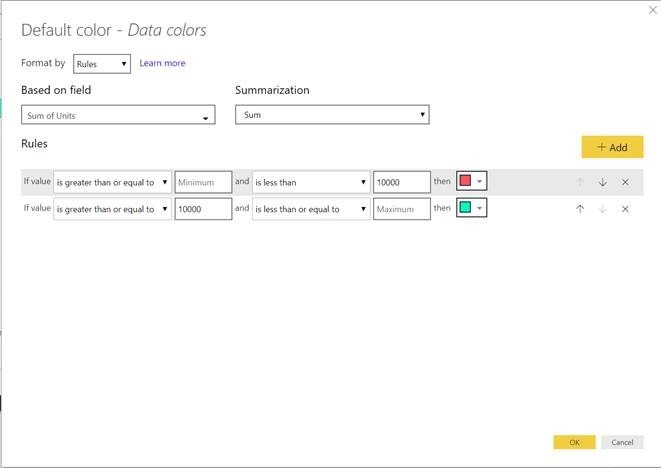
Figure 4 – Color Formatting Window
In Q&A Explorer, the possibility to ask related questions has been added. If you ask a question, for example. for products of a creditor, and then a related question, e.g. after sorting these products by sales, Power Bi outputs the filtered view to both questions.
This is not limited to 2 questions, but can be done multiple times. The questions are displayed in a history to track the process.
This allows, for example, to add fields or filters, apply different filtering or replace the item that the graphic represents. The previous filtering will be retained.
Modeling
As a preview, a new view for relationships has been added to modeling, which is initially displayed in addition to the old view when activated.
Here the biggest advantage is the increase in performance. More tables can be displayed and linked. In addition, you can create different views, comparable to the folders in Excel, to display individual topics of a report independently of others. This promotes clarity immensely.
It is now also possible to change the properties of several fields of a table at the same time. To do this, select the fields concerned and the properties tab will now display the common properties, which you can now change with one click.
Other modeling news include Composite Models, which are now fully implemented, accessibility of models via keyboard and screen reader, and new DAX functions, which are especially helpful for the new fold-out function.
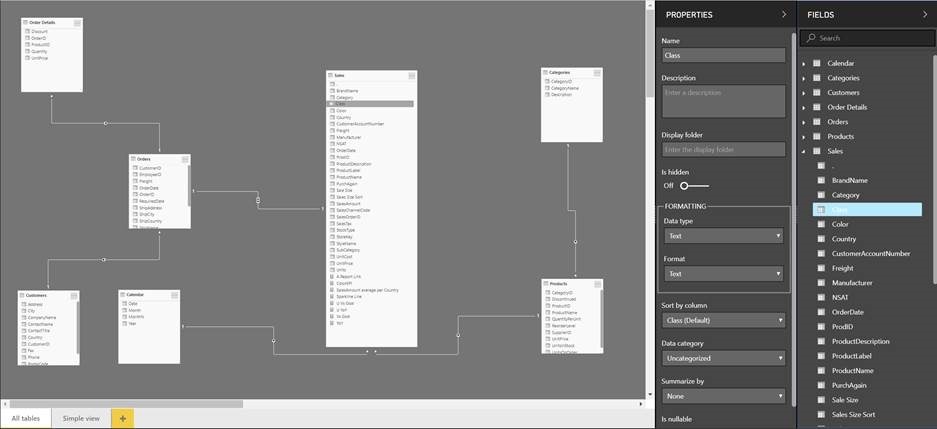
Figure 5 – new modeling view
Custom Visuals
Custom visuals introduced this month were the “Calendar by MAQ Software”, a calendar that lists events and includes different views.
“Ratings by MAQ Software” offers visuals for the rating, which can be displayed in different styles.
“Hourglass Chart by MAQ Software” lets you compare 2 scenarios visually very nicely. Data from Scenario 1 is shown on one side, and data from Scenario 2 is shown on the other, so that differences are quickly and clearly displayed.
For forecasting a development, “Forecast Using Multiple Models by MAQ Software” is a good choice. Based on the available data, this graph predicts, through various predictive models, the further course and presents them graphically.
Lastly, the “Pie Charts Tree by Aritz Fancoy” was presented, which displays data in a tree structure, at the ends of which pie charts can be inserted.
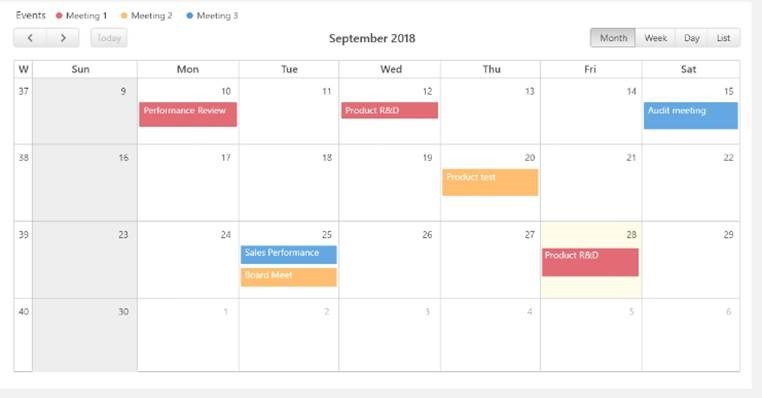
Figure 6 – Calendar by MAQ Software
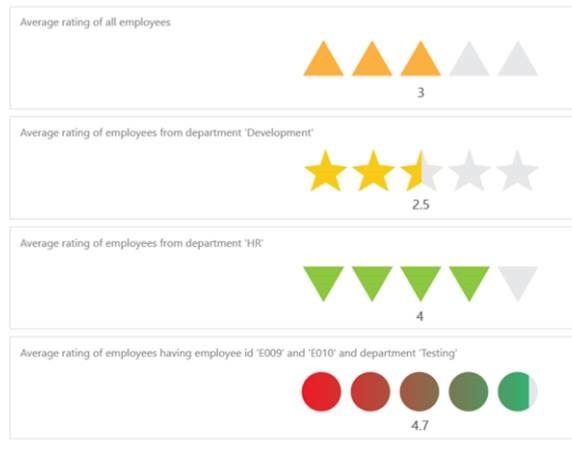
Figure 7 – Ratings by MAQ Software
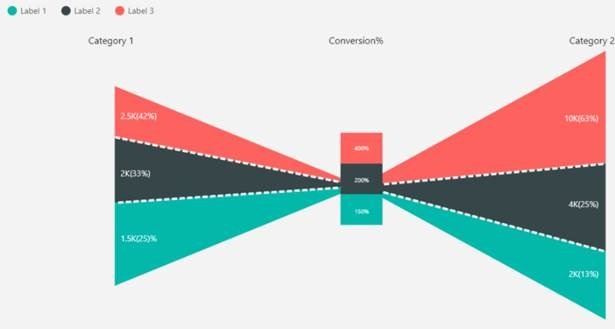
Figure 8 – Hourglass Chart by MAQ Software
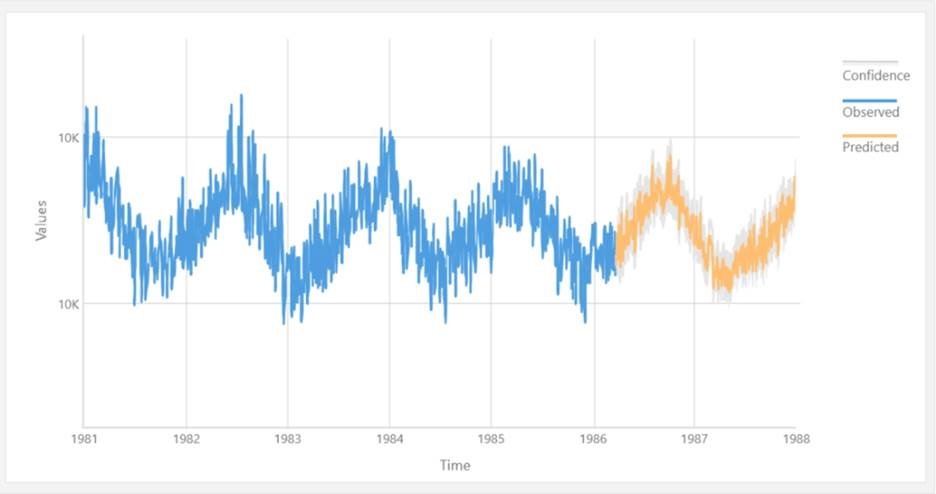
Figure 9 – Forecast Using Models by MAQ Software
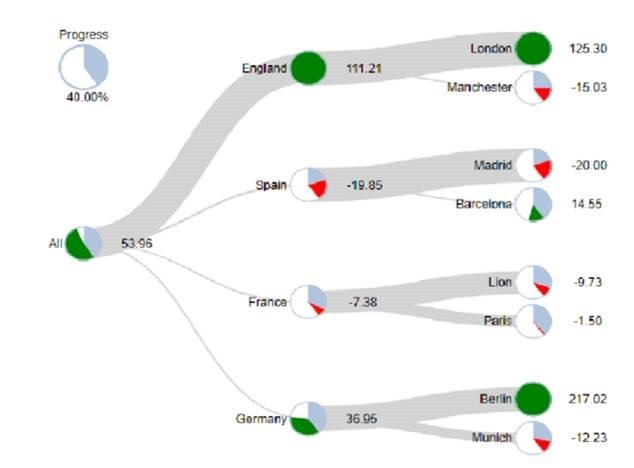
Figure 10 – Pie Charts Tree by Aritz Fancoy
Data Connectivity
There are also updates in Data Connectivity.
First of all, there is a new connector for “Azure DevOps Server” to import data from there.
The “PDF Connector” now offers the possibility to define start and end pages so that Power BI only imports certain pages.
That’s it for this month. I hope you enjoy the new content.
Until next time.
Tobias Wirths
If you would like to learn more about the possible uses of Microsoft Power BI or need a partner for the implementation, please contact us!