


Our NAS’LER report from everyday project life
Evaluations play an important role in companies in order to analyze processes and results and thus make future development plannable.
In my experience, evaluations, be it sales, inventory or project evaluations, are still far too often done in Excel.
The raw data is usually copied manually into a created template, calculations are performed and graphics are created for the next Power Point presentation.
Nowadays, there are far better solutions for this, which retrieve the data automatically, enhance it and present it in a visually appealing way.
Power BI is the BI solution we like to implement for our Business Central customers to simplify reporting.
Recently, we were approached by a customer who would like to have evaluations of product sales per article category, article and month in comparison to the previous year, which, according to the customer’s wishes, do not exist in Business Central.
Instead of spending a lot of time creating this evaluation as a rigid report in Business Central, I introduced the possibilities that Power BI offers.
I was able to quickly convince our customer of the benefits, so I was able to start setting up the Power BI service.
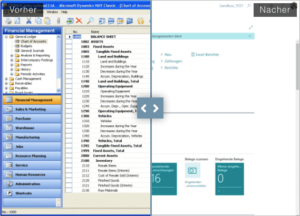
After preparing in Business Central to provide the data, I was able to connect to Business Central in Power BI and load the desired tables into the dataset.
So that Power BI is able to connect e.g. the articles and the posted invoices and filter the sold quantities per article category, I have created relationships between the tables.
Once the basis for the analyses, i.e. the linked data, is uploaded to the Power BI service, I can use it as the basis for countless reports. If other requirements are added later, for which additional data is needed that is not available in the dataset, I can simply extend the dataset.
The next step is to create the individual report. To do this, I connected to the dataset in the service with a few clicks and then merged the relevant fields into my reports. The big advantage is that Power BI analyzes the relationships through my linked tables and does meaningful calculations for me. This way I don’t have to calculate all sales invoices for the sales of one item category. Power BI does this all by itself.
Some values, like the difference between the values of the current year and the previous year, unfortunately Power BI does not provide me with.
However, in Power BI I can create calculations, called measures, that calculate this.
I have presented the comparison of the annual and monthly values once in tabular form and once as a bar chart. This makes it possible to see at a glance via the chart how sales have developed in the various years. More detailed information can be found in the table.
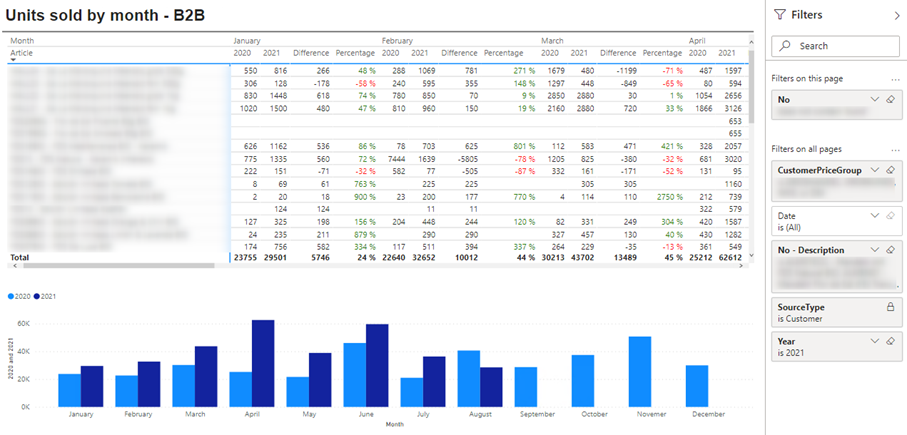
The creation of additional graphics is quickly solved in Power BI. By selecting a different visualization, Power BI converts, for example. converts a table into a pie chart.
A great advantage of Power BI reports are the countless filtering options that can be added during creation, making the evaluations of the visualizations very dynamic.
I also published the report to the Power BI service so that users with the appropriate permissions could access it.
Last but not least, I set up an automatic refresh of the data that updates the dataset several times a day with the data from Business Central.
I am already curious which evaluations will be requested soon, which I can then present in Power BI in an appealing way.
Tobias Wirths